
- Видео 90
- Просмотров 2 424 952
QuantPy
Австралия
Добавлен 23 июн 2017
This channel is all about learning quantitative finance with python.
So many channels, books, people, and even universities out there only explain financial concepts, but don't show how to implement these concepts in a meaningful and practical way. Here I aim to implement financial concepts with Python, because I believe the best way to learn is to Build Something!
My name is Jonathon Emerick and despite studying a Bachelor of Chemical Engineering and a Master in Financial Mathematics, I felt that I hadn't learned how to address real world problems or gained the skills required for success in the financial industry.
On this channel I try to fill the gaps in my own knowledge, while helping others with concepts that I have only solidified after leaving university. This channel keeps me accountable, and I hope you can gain value or insight from these learnings. Try searching on the channel page, or via quantpy.com.au/
From Black Holes to Black-Scholes
EP 003 QuantPy Insights Podcast | Davide Bufalini | The Journey from Academia to Quant Finance
📈 About This Episode:
Today, we have a very special guest, Davide Bufalini, who has transitioned from academia having studied a PhD in theoretical physics to the world of quantitative finance. In this episode, we discuss some of the largest challenges, transferrable skills and recommendations for making the transition from university to the quant industry.
🔑 Key Takeaways (Guest Perspective):
From solving one of the biggest challenges in theoretical physics to understanding market flows and behaviour, what I learned in my PhD applies to my job on a daily basis. To successfully transition to quant fi...
Просмотров: 10 520
Видео


OpenAI & Python: The Ultimate Twitter Automation Guide
Просмотров 6 тыс.7 месяцев назад
In this tutorial, we dive into automating your Twitter feed by leveraging OpenAI's Chat GPT, Python, and the Tweepy module. The bot is designed to generate tweets from a list of quantitative Python ideas using a specialized OpenAI prompt template. All of this is set up in a Jupyter Notebook environment for easy testing and modification. Tweets are then scheduled to be posted every 12 hours usin...

A 20-Year Veteran Reveals the World of Options Market Making
Просмотров 35 тыс.7 месяцев назад
EP 002 QuantPy Insights Podcast | Anonymous Guest Welcome back to the second episode of QuantPy Insights, where we dissect the complex world of quantitative finance and break it down for you! 📈 About This Episode: Today, we have a very special guest who has spent over two decades in the fast-paced realm of options market making. We dig deep into the intricacies of market making, from how firms ...
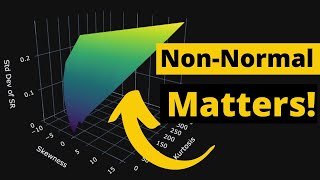
Is your Sharpe Ratio is Lying to you? Use this instead
Просмотров 6 тыс.8 месяцев назад
“Although skewness and kurtosis does not affect the point estimate of Sharpe ratio, it greatly impacts its confidence bands, and consequently its statistical significance” Bailey and López de Prado (2012). In the last video we explained the downfalls of relying on the Central Limit Theorem (CLT) and using the mean and standard deviation to calculate a point estimate of the Sharpe Ratio. In this...

You will need to be the kind of person who loves to solve problems · Octavio Baraldo Queijeiro
Просмотров 10 тыс.8 месяцев назад
EP 001 QuantPy Insights Podcast | Octavio Baraldo Queijeiro Octavio began his journey in quantitative finance after completing a mathematically-oriented economics undergraduate program in Argentina. Intrigued by the rapidly evolving landscape and machine learning developments he witnessed in China, his curiosity steered him toward the field of quantitative finance. Armed with this newfound moti...

Stop making investment decisions using this metric!
Просмотров 8 тыс.8 месяцев назад
The Pitfalls of Relying on the Central Limit Theorem in Portfolio Return Analysis. In the world of finance, both individuals and investing professionals alike strive for making sound investment decisions with consideration of risk. Usually this process involves understanding and analysis of portfolio returns. Central to this methodology is the Central Limit Theorem (CLT), a statistical concept ...
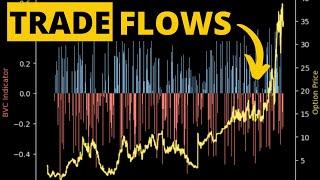
Inferring the Aggressor using Options Data
Просмотров 11 тыс.Год назад
We will be implementing the bulk volume classification algorithm to attempt to discern information from tick by tick trade data. We will be using ThetaData's API which provides both Historical and Real-time Streaming of Options Tick Level Data! We first explore what algorithms have been used previously to attempt to infer the aggressor (the trader who initiates the trade), which would classify ...

Real-Time Streaming of Every Option Trade
Просмотров 17 тыс.Год назад
After searching for a number of years for a good solution for all my financial data needs, I have finally found ThetaData's API which now provides Real-time Streaming of Options Tick Level Data! In this video we go through how to add all available tick level NBBO trades data to your ThetaData real-time stream. We then explore how you can add only specific contract streams you are interested in,...

Machine Learning in Finance Course
Просмотров 16 тыс.Год назад
Master the most in-demand skill-set of the world's top financial institutions with one of the most practical, comprehensive and affordable courses in Financial Machine Learning. ★ ★ Machine Learning in Finance ★ ★ Release Date: EST 1200 01-Dec Learn more and register your interest here: quantpy.com.au/machine-learning-in-finance-course/ Why I started an online Course? ★ The QuantPy Story ★ If y...
Historical vs Implied Volatility with 10yrs Options Data!
Просмотров 15 тыс.Год назад
In today's tutorial we investigate how you can use ThetaData's API to retreive 10 years of historical options data on Microsoft (MSFT) for comparing Implied Volatility to Historical Volatility. We also describe what the difference between historical volatility and implied volatility actually is. Realized volatility (rv) is the actual stock price variability due to randomness of the underlying B...
Risk Neutral Pricing of Weather Derivatives
Просмотров 6 тыс.Год назад
In this video, we finally use the risk-neutral pricing methodology for valuation of our temperature options in python. In this online tutorial series dedicated to weather derivatives we have estimated the parameters of our modified mean-reverting Ornstein-Uhlenbeck process which defines our Temperature dynamics, and have now implemented different models for our time varying volatility. Now we m...
Can You Compare Intraday Volatility Surfaces?
Просмотров 13 тыс.Год назад
In today's tutorial we investigate how you can use ThetaData's API to retreive historical options data for end-of-day, and intraday trades and quotes. We will create volatility surfaces use an interpolation method (B-Splines) to compare surfaces between the morning (10am) implied volalitity and afternoon (2pm) implied volatility surfaces. Check out ThetaData's API (includes free tier) www.theta...
Monte Carlo Simulation of Temperature for Weather Derivative Pricing
Просмотров 8 тыс.Год назад
In this online tutorial series dedicated to weather derivatives we have estimated the parameters of our modified mean-reverting Ornstein-Uhlenbeck process which defines our Temperature dynamics, and have now implemented different models for our time varying volatility. Now we move on to simulating temperature paths using Monte Carlo simulation method under the physical probability measure. Once...
Time Varying Volatility Models for Stochastic Finance | Weather Derivatives
Просмотров 8 тыс.Год назад
Now that we have a defined the parameters of our modified mean-reverting Ornstein-Uhlenbeck process which defines our Temperature dynamics, in this tutorial we will now be looking to implement different models for our time varying volatility patterns. We have a number of options to model temperature volatility across seasons. - Piece-wise Constant Functions (volatility for each season) - Parame...
Modifying the Ornstein-Uhlenbeck process | A practical application of stochastic calculus for Quants
Просмотров 16 тыс.Год назад
Our goal today is to use our knowledge of stochastic calculus in a practical way to fit a mean-reverting stochastic process to real world data under the physical probability measure. We will attempting to model the variation of the difference between daily average temperature (DAT) and our deterministic seasonal temperature model which takes into consideration temperature trend and seasonality....
Detrending and deseasonalizing data with fourier series
Просмотров 19 тыс.Год назад
Detrending and deseasonalizing data with fourier series
Statistical Analysis of Temperature Data | Time Series Analysis in Python | Weather Derivatives
Просмотров 15 тыс.Год назад
Statistical Analysis of Temperature Data | Time Series Analysis in Python | Weather Derivatives
Introduction to Temperature Derivatives | Weather Derivatives
Просмотров 10 тыс.Год назад
Introduction to Temperature Derivatives | Weather Derivatives
Does Index Fund Investing Still Work in 2023?
Просмотров 8 тыс.Год назад
Does Index Fund Investing Still Work in 2023?
The Magic Formula for Trading Options Risk Free
Просмотров 20 тыс.2 года назад
The Magic Formula for Trading Options Risk Free
You Need to Learn Importance Sampling NOW | Deep Out of the Money Options
Просмотров 7 тыс.2 года назад
You Need to Learn Importance Sampling NOW | Deep Out of the Money Options
You've been using the Wrong Random Numbers! - Monte Carlo Simulations
Просмотров 10 тыс.2 года назад
You've been using the Wrong Random Numbers! - Monte Carlo Simulations
Lookback Call Options with Stochastic Volatility
Просмотров 3,6 тыс.2 года назад
Lookback Call Options with Stochastic Volatility
Pricing Asian Options in the Australian Electricity Market
Просмотров 6 тыс.2 года назад
Pricing Asian Options in the Australian Electricity Market
Monte Carlo Pricing of a European Barrier Option
Просмотров 7 тыс.2 года назад
Monte Carlo Pricing of a European Barrier Option
Monte Carlo Simulation with Multiple Factors | European spread options with stochastic volatility
Просмотров 6 тыс.2 года назад
Monte Carlo Simulation with Multiple Factors | European spread options with stochastic volatility
Stochastic Volatility Models used in Quantitative Finance
Просмотров 25 тыс.2 года назад
Stochastic Volatility Models used in Quantitative Finance
Heston Model Calibration in the "Real" World with Python - S&P500 Index Options
Просмотров 23 тыс.2 года назад
Heston Model Calibration in the "Real" World with Python - S&P500 Index Options
Simulating the Heston Model with Python | Stochastic Volatility Modelling
Просмотров 24 тыс.2 года назад
Simulating the Heston Model with Python | Stochastic Volatility Modelling
Trading stock volatility with the Ornstein-Uhlenbeck process
Просмотров 24 тыс.2 года назад
Trading stock volatility with the Ornstein-Uhlenbeck process
How does the coding change for American options?
best channel
Great job
how to implement this data for mt4 chart? , how to deploy?
This tutorial is so well done. Thank you thank you thank you!!
i am not sure what i did wrogn but i chose four stocks ['MC.PA', 'AI.PA', 'SAN.PA', 'BNP.PA'] and I got the weirdest looking efficient frontier
hello mate, why is it the timedelta(days=300)? where does the 300 come from ? thanks
thanks you a ton , I have been trying my best to learn but none of the videos strategies worked well from RUclips , but you are a gem .....salute to you as your strategy gave me confidence and growing a lot on demo account and soon I will switch to live account
Great Appreciation and Great Respect to you and your channel!
This is all very fluffy info. Nothing here that will make you money. Also Shelly Natenberg is not a trader. He only discusses theory. If you want to experience real pain go buy some upside calls and sell futures delta neutral against them during a trend day up. You’ll be given no chance to scalp. And by the end of the day you will have lost on your calls and lost big on your futures. While the market maker, who had zero idea where the underlying was going, wins and wins. I’m not saying it isn’t possible to make a lot of money. It is. You have to become an expert is managing risk. This is your edge.
And btw, the best traders on the planet learned their risk management skills by trading the underlying. And not by predicting direction. Nobody can do that with any level of consistency. Options market makers only understand their Greeks and how to manage their risk. A very skilled futures or stock trader will use market makers for what their purpose is. Risk offsets. And, > this is the most important part, parlays. Options give a skilled trader incredible opportunities where you can go from flat to short 200 futures below a line that you can convert and now you’re riding long 200 futures up 10 points with very defined risk. This is very doable way to make $100k a day. And with 0DTE these opportunities exist every day of the week.
but cov matrix is now always invertible (if matrix is not positively defined), so cholesky decomposition does not always work
Hi QuanPy, thanks for the great video! One question do you have any detailed explain or recommended material for the portfolio return at the t, the formula you show up on the right upper corner from 11:35? I know single stock Brownian Motion, but I am not following why portfolio return is in that form and why use timeseries mean return as level. Also should it depend on t as well as BM? Many Thanks!
if you get into Quant trading during a bull market, you will think that you know what you are doing.....till you will find out otherwise......you have greater chances of beating the market if you play old school pacman....(the one with the blue screen) than learning quantitative financial analysis....lol, ..and I kid you not about pacman or space invaders.
Skip the first 7 minutes.
Did he say $300K out of college ? blimey.
Could someone please help me find the website he uses in the video? He says it is free. I am tried a bunch of ways to find it, but I cannot. Does it still exist? Please help
If there is only 1% of a succesful strategy, why there is no 99% of strategies are wining money by only switching the direction of the entry at market?
Hi there, good question. You’re assuming only two outcomes here, up and down and that the direction change is a large enough effect size to make a profit. Otherwise as you are implying you could just short / go the other direction in your strategy and it would be profitable. Once you take into consideration fees (transaction and paying bid-ask spread), you’ll find that very few strategies have a true sharpe ratio that is significantly higher than 0.
Thanks for the GREAT video! One question if I may: at 11:42, would you please elaborate, or if you have another link, for this return formula + Cholesky application? Thanks a lot!
What's the point of complicating matters by throwing in abstractions/ indirections such as covariance matrix and cholesky decomposition, when we can just simulate portfolio returns by calculating cumprod of weighted stock returns directly?
So… around #16:37 … the MLE-estimated mean and variance of a normally distributed set of returns R equal… ("someone has done the hard job for you, they've gone through the math")… the mean and variance of samples r_i…?!? 🤨 Guess I'm missing the point of the entire MLE-concept in this context.
Him: All RUclipsrs offer fake advice on algo trading Also Him: Let me tell you how to trade on this RUclips video The assumption that RUclipsrs have some deep seated ulterior motives, well except for you, is silly.
Well i think non normal error distribution caused by non monotonous growth the chart in a real.. You trying to multiply perfect line and perfect sin() and the modeling chart will growths monotonous while the real one - not. And of course You will get some excesses thant moment the real chart will start to grow like parabolic in average.. As for me thats pretty obviously.. I think the real chart should be additionally averaged, thats makes the average error bigger but makes it close to normal... (There is why You started to talk to try ARIMA like model i think..) Or to try the rose noise, i heard someone using to modeling the stock prices.. But the season decomposition with Fourier i think should be awesome to timing the stock market..
I have a question, If i want to forecast next 4 days in a stock price should i set my T value as T = 4 or T = 4/252
When you divide by 365 @ the end of the 17th minute there, do you not need to divide by 255 (1 year trading days)?
А вообще тяжело здесь подниматься? Только скажите честно, без балды
Tried to run the Jupyter Notebook but EOD returned error message: "Only EOD data allowed for free users. Please, contact our support team"
portfolio_sims meaning portfolio of simulations? Tip: Use the typing module to explain types and use descriptive variables to make sense
Nice! but te music is too loud.
lame
The only ones who are really winning: Market makers and brokerage firms. The others are at the mercy of luck, with inconsistent wins and losses.
error: module is not found for pandas_datareader
does someone have the link to 2rd part of video?
Hi PyQuant! May I know is it possible to simulate stock prices using the same technique? In this video you assume the returns follows multivariate normal distribution and then do the Monte Carlo simulation for returns. I am wondering if I can do the same thing for stock prices by assuming certain distribution such as GBM?
It would be interesting to see how time value is determined.
Newbes may become frustrated by this video ... but ... hes telling truth ... Investors gain success only by developping strategies beyond well known infos and models. Total transparency causes no chance for mechanical/software-driven success. First you have to learn all about common tools and strategies ... then you have to select and check ... then make a decision about your own strategy ... then check the markets for chances ... Dont forget - the closer you stay at mechanical workflows, automated ones the more compettitors you get ... and the more you develop your own system the more risk you take until reality fits to it.
Another clown. Stopped watching after hearing "I will show you my 3 strategies that are guaranteed to make money". What a joke 😂😂
This is more relevant to ML strategies. Good video anyway
Doom is coming for the world get ready worst than corona
As an Algorithmic Trading Quant, which is the most exclusive and cryptic type of Quant, I can objectivelly and without any bias that this role is meant only for men who have an eidetic memory, prophetic vision, omniscient sagacity and a coruscant brilliancy to easily master fields which are by nature both recondite and often out of reach for the common genius. Basically, a quant is a person who has a profitable trading algorithm with a track record which has stood the test of time. Also, if you're a lower class of Quant, you're basically a data scientist or wanker. If you think physics and maths is hard, remind yourself that those guys try to be quants and fail so hard they start to teach physics to PhD.
I want discussion on topics not mentioned in books like people on other side of trade and orderflow analysis
Background music that last for two minutes is very noisy
Johnatan how is it possible to transfer cryptocurrency to your account for HFT traiding under your control?
The video is cool and useful but the code don't work, the move of price of the option is not coherent with the strike one
What is with the stupid background music?
I don't get it. Why is the covariance matrix used? This means the stocks are not independent from each other. They are the same industry but apart from that they should not be tied together. What am I missing? Does this portray the sentiment of the market as a whole?
Ok, after taking a closer look at the scatter plot STO vs. BHP I agree. They are tied together.
The Black and Scholes equation is wrong: The Black and Scholes (risk-neutral) premium is the first moment of the option expiry for an asset that has all risk and no market return (the risk-neutral measure), that which has been debased of market return (by holding portfolio returns fixed flat at r). This idiotic asset (the risk-neutral measure) is stochastically dominated by bonds in that bonds have the same return (r) but without the risk whilst it is stochastically dominated by stocks since stocks earn market return for the equivalent amount of risk: bonds have LOWER RISK for the SAME RETURN as the debased market asset (the risk-neutral measure) whilst stocks have HIGHER RETURN for the SAME RISK as the debased market asset (the risk-neutral measure) Either way, the 'risk-neutral measure' is totally idiotic and stochastically dominated by all non-redundant asset classes. It is not deep and it is not abstract. All it is is the market asset without return (which is then used to price the derivative and so is wrong and inaccurate). If a trader wants an option, then he must not take an offsetting position that nullifies the option position. There is nothing risk-neutral about that. An option premium must have a mean mu in the drift term, otherwise it is wrong... wrong for derivatives and wrong for efficient and non-communist finance. nb: I had to say 'no risk' when I sat several of the courses in undergraduate (almost two decades ago). It was clear as day to me then that it was inaccurate (and proved by me definitively now more than one decade ago).
THanks, I learned a lot
For those struggling to get the Yahoo data: instead of using "from pandas_datareader import data as pdr", use "import yfinance as yf" then, the function should be "StockData = yf.download(stocks, start, end)['Adj Close']"
Excellent video, Congrats!!...btw, I could not find the website you refered to at the end of the video. I wonder if you could share the URL or link with us. Thx in advance!
im on mac and im not really sure how to get jupyter lab working i have pandas and pandas-datareader downloaded in python but it is not working